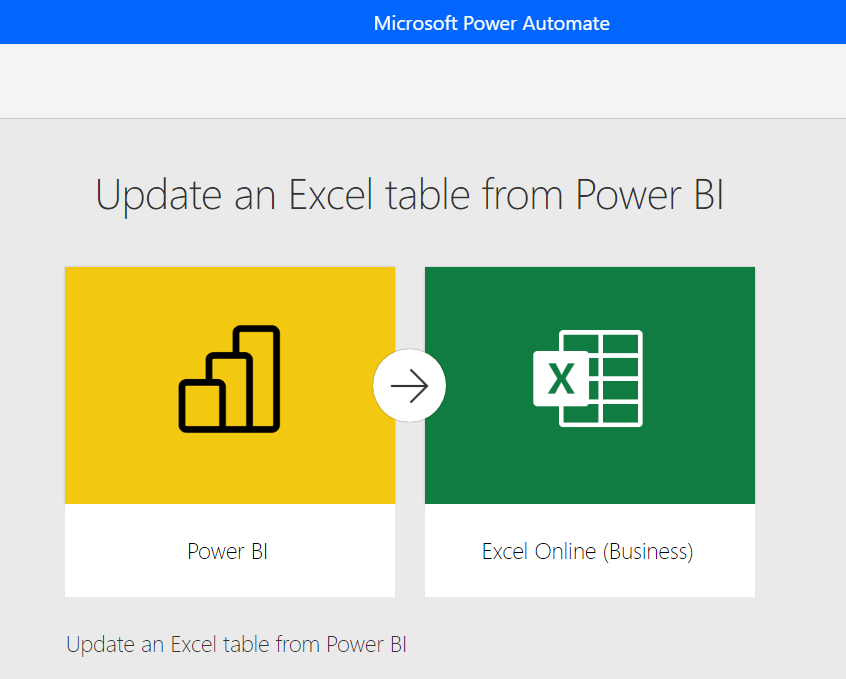
Power BI have included what?
Yes, that’s right, Microsoft have now added a Power Automate Visual into Power BI Desktop, on top of the PowerApps Visual they also recently introduced.
But what does this mean and how does it benefit you?
Microsoft have now implemented nearly full capability of Power Automate into a Power BI Report. This means you get full functionally to design your flows triggered within a Power BI Report and use those triggers straight away.
Yes, just as you are able to design flows in Microsoft Teams, you can do the same in Power BI.
Furthermore, the executed flow can be data contextual, meaning that the Flow inputs can be dynamic based on the filters set by the end-user.
Sounds great right?

So how do I get started?
So unfortunately, this visual is only a preview at the moment, and unlike the PowerApps Visual already displaying in the visuals pane, you have to go to the visuals App Source and install it from there.
Once you have installed the visual, drag and drop onto your page.

How does it work?
Once you have popped the visual onto your page, start adding data from your fields pane. Ideally, you should add the data that you want to flow to interact with.
Once you have added what you require, click on the 3 ellipses of the visual and hit edit. You can now see a complete Power Automate interactive flow pane. Over here, you can create flows triggered from Power BI through templates. Now, if the template does not suit your specific requirements, do not stress. You can always load the template and later remove/add actions you require.
Once you have set up your flow, your trigger is ready. You can also style the trigger button like any other Power BI button, so it has that unique look and feel.

PS. Don’t forget to share the flow with those that require access to the report 🙂
How TDDA has used this feature?
This new feature unleashed tremendous possibilities. TDDA applied a simple flow utilising the Power BI – Power Automate visual, that will allow for users to export specified data into a csv, that would then be stored on a SharePoint Site. The csv is automatically named after the dataset and date it was extracted and can be viewed amongst all those that require it.
It then creates a Microsoft Teams notification and proceeds to set tasks.
Microsoft do however plan on including more templates in the future.
Sources:
https://powerbi.microsoft.com/en-us/blog/announcing-the-new-power-automate-visual-for-power-bi-reports/
Share this:
- Click to share on Facebook (Opens in new window) Facebook
- Click to share on X (Opens in new window) X
- Click to email a link to a friend (Opens in new window) Email
- Click to share on LinkedIn (Opens in new window) LinkedIn
- Click to share on Telegram (Opens in new window) Telegram
- Click to share on Threads (Opens in new window) Threads
- Click to share on WhatsApp (Opens in new window) WhatsApp


